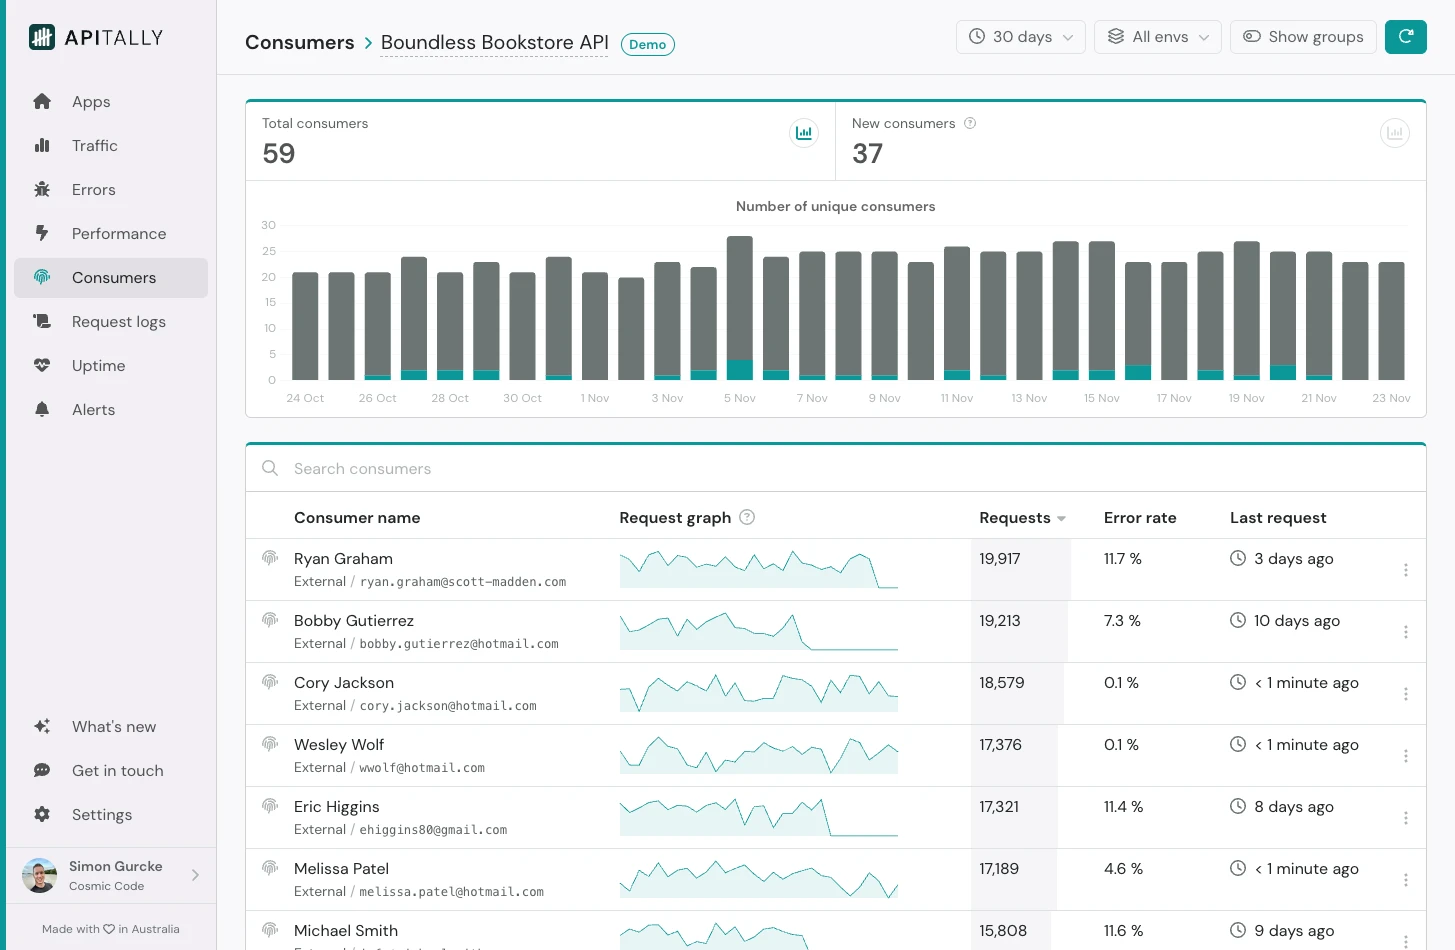
 Apitally allows you to track API adoption and helps you understand how individual consumers use your API.
The chart at the top of the Consumers page shows the number of unique API consumers that have made requests to your API over time, broken down by new and returning consumers.
You can select from different time periods in the dropdown above, and filter by environment.
The table below the chart lists all API consumers, including sparkline graphs for a quick overview of their requests.
Apitally allows you to track API adoption and helps you understand how individual consumers use your API.
The chart at the top of the Consumers page shows the number of unique API consumers that have made requests to your API over time, broken down by new and returning consumers.
You can select from different time periods in the dropdown above, and filter by environment.
The table below the chart lists all API consumers, including sparkline graphs for a quick overview of their requests.
Consumer details
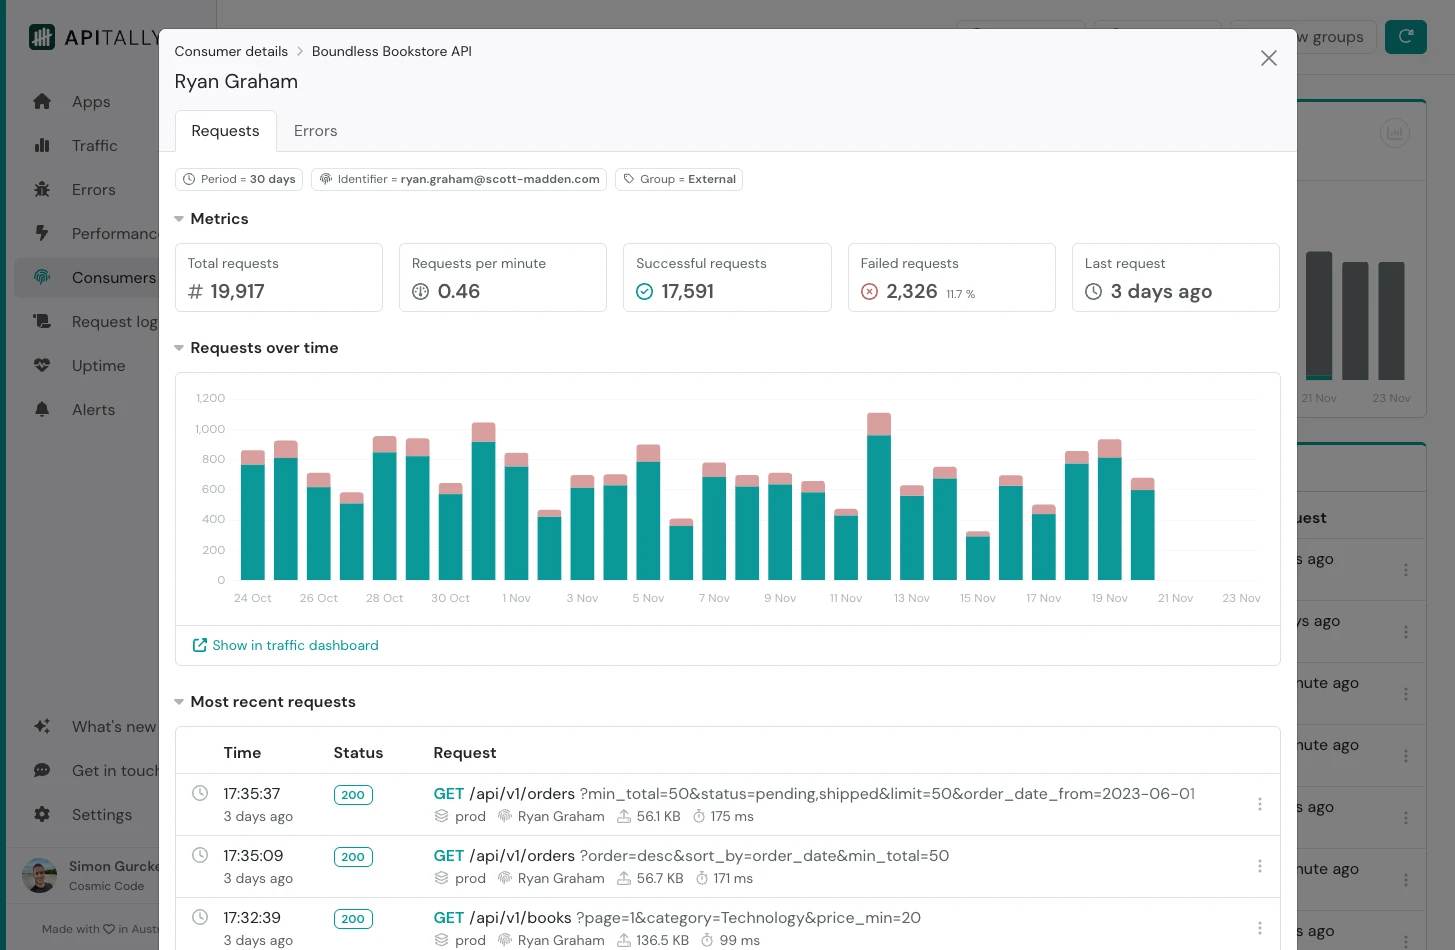 Clicking on a row in the consumer table brings up the consumer details screen, which has a Requests and an Errors tab.
On the Requests tab you’ll see consumer-specific metrics, a chart showing the consumers’ requests over time, and a log of the most recent requests by that consumer.
On the Errors tab you get an overview of the types of errors encountered by the consumer, including a chart showing errors over time and a log of the most recent errors.
Clicking on a row in the consumer table brings up the consumer details screen, which has a Requests and an Errors tab.
On the Requests tab you’ll see consumer-specific metrics, a chart showing the consumers’ requests over time, and a log of the most recent requests by that consumer.
On the Errors tab you get an overview of the types of errors encountered by the consumer, including a chart showing errors over time and a log of the most recent errors.
Consumer groups
You also have the option to create and analyze groups of consumers. For example, if you have both internal and external API consumers, you could create two groups to understand their API usage separately.Each API consumer can only be assigned to one group at a time. Assigning a consumer to a new group will remove it from their current group.